- Published on
How Far Ahead Should Managers be Planning? Introducing the Series Solver
- Authors

- Name
- Tristan Mott
Why Solve a Series?
Our regular game-theoretic solver computes Nash equilibrium strategies by considering every possible sequence of management decisions that could be made in a game. The recommendations it produces are optimal in the sense that they maximize win probability according to the matchup model being used. However, we must ask ourselves if win probability is really the value that MLB managers care about maximizing.
In some situations, win probability is certainly the only thing that matters. For example, in game seven of the World Series, win probability is exactly equivalent to championship probability, the ultimate goal of any baseball team. But what about game one of a regular season series? If using up eight relief pitchers is the best way to maximize win probability, should you actually do it? Probably not. The reason this is probably a bad idea is because some of those pitchers won't be able to pitch tomorrow if they pitch today, potentially losing future win probability.
This is a complex problem, indicating the need to carefully balance the goals of winning today and winning in the future. MLB managers often rely on a combination of human intuition and league tradition in order to strike this balance. For example, the traditional "closer" role was adopted partially in order to solve this problem. The idea is that you save your best reliever for the 9th inning. If the game is close and you have a good chance of winning, you use your closer to "save" the game; otherwise, you reserve them for tomorrow or the next day.
Heuristics and traditions like this can be helpful, but there is no guarantee that they are optimal. In fact, there is no guarantee that they are even good. The only way to know for sure is to solve the problem mathematically and see what the optimal strategy looks like. This is exactly what our series solver does. Instead of optimizing win probability for a single game, our series solving algorithm optimizes expected wins over a sequence of several games. It still cares about winning the current game but it equally cares about winning tomorrow, finding the perfect balance in every recommendation.
How We Do It
The reason this is a problem in the first place is because relievers cannot pitch every day; if they could, managers would be able to safely maximize win probability, knowing the exact same strategy will be available to them the next day. Solving this problem requires linking the current game to future games by imposing inter-game constraints on relief pitcher usage. These constraints specify how frequently each reliever can be used (e.g. a reliever can go back-to-back or a reliever must have at least one day of rest between appearances) and how many batters each reliever can face when they are used.
In our platform Perfect Game, we allow users to specify all of these constraints when solving a series. Then, we solve the Nash equilibrium strategy for the entire series, starting with the last game. Once we have solved every version of the last game (all combinations of reliever availability), we can solve the second-to-last game, taking into account all versions of the last game (it knows the win probability in the last game will be highest when the entire bullpen has been rested and lowest when the entire bullpen has been used). We repeat this process all the way back to the first game, which is the game actually being played today. The recommendations our algorithm makes for the first game are then able to perfectly balance winning today with winning in the future.
Mariners vs Mariners
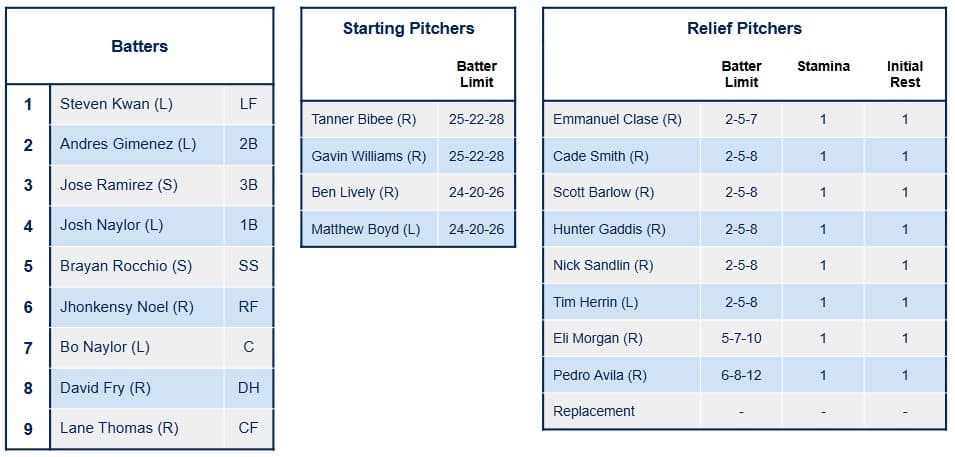
One way to test the abilities of this algorithm is to solve and simulate a series between two identical teams, with one managed by the greedy one-game solver and the other managed by the patient series solver. I did this with a four-game series where the Seattle Mariners played themselves. Our matchup model used data through the end of the 2025 season. Here are the lineups and bullpens I used:
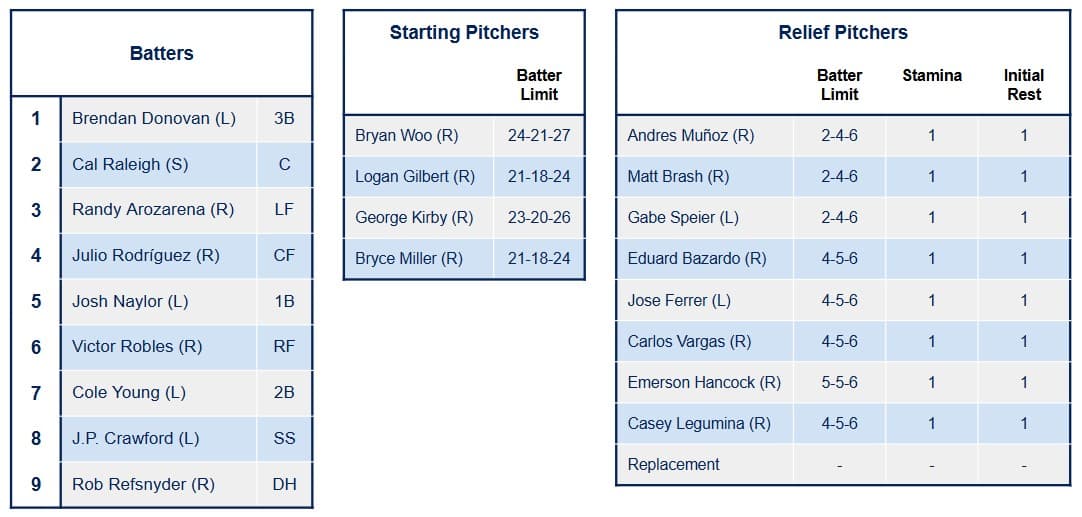
The batting order was the same for all four games. Four different starting pitchers were used and eight relievers were used (a 9th "replacement" reliever was also used and represents a position player pitching). Each pitcher has three values representing how many batters he can face per appearance:
- End inning max batters faced: if a pitcher has faced at least this many batters and finishes an inning, they cannot return to the game.
- Lower max batters faced: unless constrained by the end of an inning, a pitcher can face at least this many batters in an appearance.
- Upper max batters faced: the most batters a pitcher can face in an appearance. The true limit is uniformly sampled between the lower and upper max batters faced.
Relief pitchers also have two inter-game usage constraints: stamina and initial rest. Stamina is the number of consecutive games a reliever can be used in, and initial rest is the amount of stamina they start off with. To keep it simple, all of the relievers in this series have a stamina and initial rest of one, meaning they cannot be used in back-to-back games and all start out the series rested.
In simulation, I had the greedy and patient managers play against each other and against themselves hundreds of thousands of times. The results were fascinating.
Overall Results
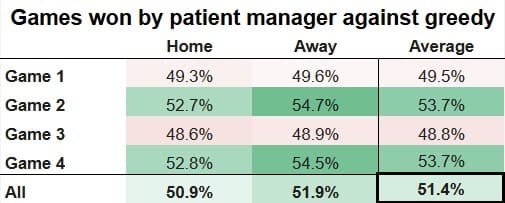
The greedy manager and the patient manager played this four-game series against each other 64,000 times, with each algorithm playing as the home team in half the simulations (total of 256,000 games). Here are the results:
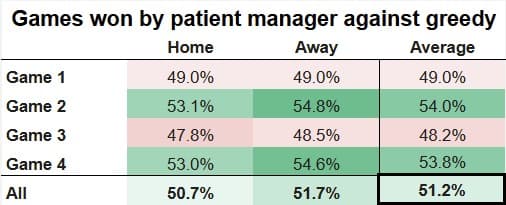
Unsurprisingly, the greedy manager won game one the majority of the time (this is what they are optimized to do), as well as game three. However, the patient manager took back these wins and then some in games two and four, ultimately winning 51.2% of all games. Interestingly, the away team has the advantage in this formulation. This is because the away team does not pitch for the last half inning in a loss, allowing them to more easily preserve their relievers (also because our matchup model does not add any home field advantage).
Usage by Inning
Having established that the series solver adds value (roughly two wins per 162 game season), I dug into the simulation results to try and discover how it adds value. The first place I looked was at relief pitcher usage by inning. For each manager, I computed the distribution over innings when each reliever was brought into the game during game one. I also looked at the total game one usage rates for each reliever.
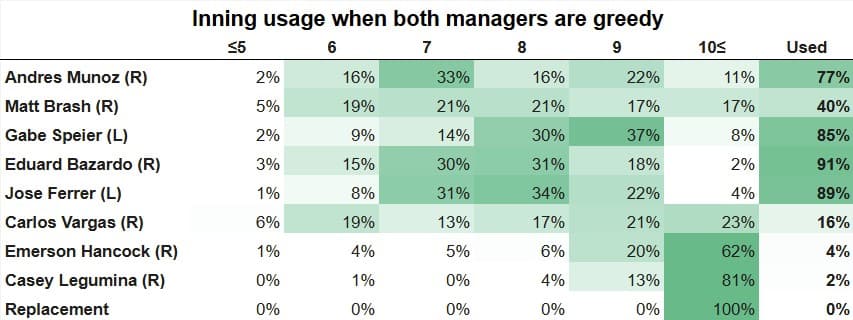
The first thing to notice is that the greedy manager uses top relievers at a much higher rate than the patient manager, and hardly ever uses the less skilled relievers in game one. Of the eight relievers, the greedy manager uses four of them over 76% of the time in game one and uses three of them under 17% of the time (Matt Brash got an average usage of 40%). On the other hand, the patient manager uses all eight of their relievers between 24% and 51% of the time in game one. This is a clear indication that the patient manager prefers to spread the talent across multiple games, while the greedy manager goes all in on the first game.
It is also insightful to look at which innings the relievers were used in. For the greedy manager, there are no obvious patterns other than the fact that the less talented pitchers were usually used in extra innings when everyone else had been used up. The usage for everyone else seemed to be normally distributed across the second half of the game after starter Bryan Woo finished his outing.
The inning usages for the patient manager are much more interesting. Usage rates for top relievers are skewed towards the end of the game, while usage rates for mid-tier relievers tend to be higher in the middle innings. The least talented relievers are also used at the end of the game, likely when the game has already been won or lost (also known as "garbage time"). This pattern is more similar to the MLB tradition of using a closer, though it is important to note that the series solver does not follow that trend exactly. For example, only 40% of Andres Munoz's appearances came in the 9th inning or later even though almost all of his appearances come in these innings in real life. If anyone were to be considered the "closer" based on these results, it would actually be Gabe Speier who had 90% of his appearances come in the 8th inning or later. This could be because the Mariners batters do much better against righties than lefties. Perhaps Munoz would play a more traditional closer role against a different opponent.
Usage by Score Deficit
Another way to compare the behaviors of the different managers is by looking at relief pitcher usage by score deficit. For each manager, I computed the distribution over score deficits when each reliever was brought into the game during game one.
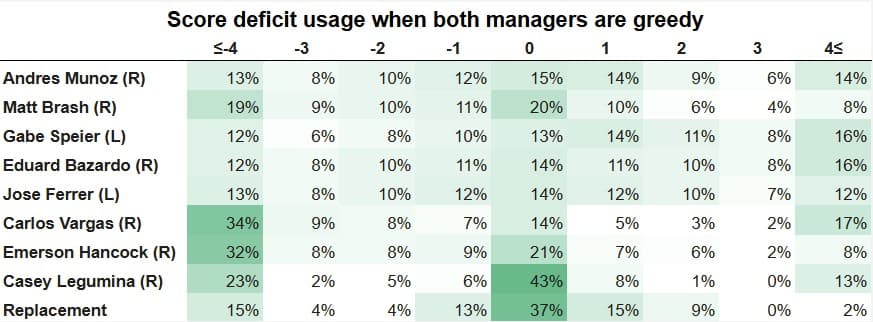
Again, there are no obvious patterns in the greedy manager's behavior. The only thing that stands out is that the bottom relievers get more usage in tie games (extra innings) and when they are down by 4+ runs (blowing through relievers because they cannot get outs). Other than that, the usage for most relievers is symmetrically distributed around a score deficit of zero, indicating that the greedy manager does not change their strategy much based on whether they are winning or losing.
The distributions from the patient manager tell a much different story. The top two relievers get almost all of their usage when their team is winning or tied; 85% for Munoz and 89% for Speier. The mid-tier relievers get most of their usage when they are losing by a little or winning by a lot and the worst relievers (mostly the replacement) are used almost exclusively in garbage time.
Using the best relievers in close games with a lead makes a lot of sense because pitchers are defensive players and cannot score runs; if you are down by one in the 9th inning and bring in your best arm, you will probably lose the game (and waste that reliever) even if he plays perfectly because no matter how good your reliever is, they cannot make your offense score runs. It is much more productive to use your best relievers to protect a lead and fully take advantage of their defensive skills. It is fascinating and incredible that the series solver is able to exhibit this behavior without ever being trained or told what a "closer" is. These strategies simply emerged from the underlying game theory and math.
Usage by Baserunner State
I also looked at relief pitcher usage by baserunner state.
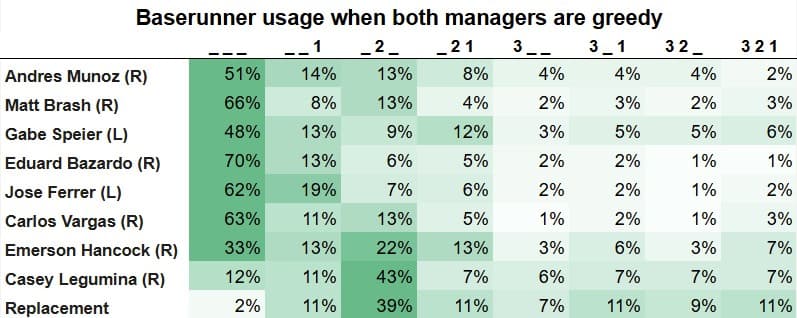
Honestly, this one was less interesting than I expected. Both managers made most of their substitutions at the beginning of the inning. This is probably because of the end inning max batters faced constraint which incentivizes the managers to wait until the inning is over before bringing in a new reliever (maybe I set those values too low). The main noticeable difference between the two managers is that the patient manager cares even more about this constraint than the greedy manager (because it helps with saving relievers for future games). There is also a pattern showing that the best relievers are less likely to start out an inning, likely because they have to come in to prevent someone else's baserunners from getting out of hand.
Usage by Batting Order
The last thing I looked at was relief pitcher usage by current batting order. Surprisingly, it appears that batting order was the number one factor influencing which reliever came in the game, even more so than score deficit.
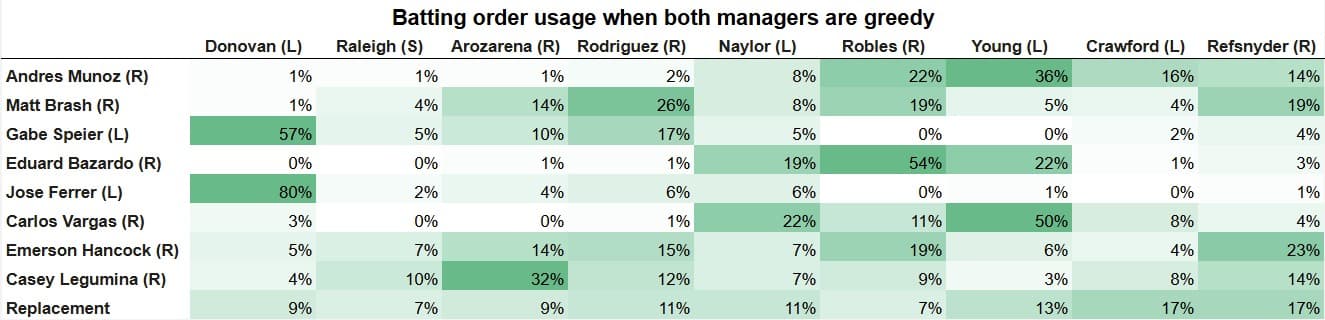
Both managers appeared to care a lot about who was up to bat when deciding which reliever to bring in to the game. This makes sense, because pitchers usually have to face at least three batters in an appearance before they can leave the game, but I was still surprised by how big of a role it seemed to play. For example, the patient manager was more likely to use Andres Munoz with a lead of 4+ runs (1%) than it was to bring him in with Randy Arozarena up to bat (0%). Speier and Ferrer were never brought in against Victor Robles and Eduard Bazardo was never brought in to face Brendan Donovan at the top of the order. Matt Brash was kind of used against everyone, but that makes sense because he had a reverse platoon split in 2025 (he performed better against lefties despite being a right-handed pitcher).
Clearly handedness is playing a big role here, but not always in the ways you would expect. Usually, pitchers perform better against same-handed batters. But why is right-handed Andres Munoz never brought in to face right-handed Randy Arozarena and Julio Rodriguez? Digging deeper shows that both of these batters go against the grain, performing better against right-handed pitchers in 2025 (Arozarena had a righty/lefty OBP split of 0.350/0.296 and Rodriguez had a split of 0.328/0.312). This means the first five batters (with the exception of switch-hitting Cal Raleigh who does pretty well either way) all perform better against right-handed pitchers and worse against left-handed pitchers. This explains why lefties Speier and Ferrer see such high usage spikes at the top of the order. The bottom of the order includes two righties plus reverse-splitting Cole Young, explaining why it is more suitable for right-handed pitchers like Munoz and Bazardo.
Takeaways
This simulation shows that the series solver is a powerful tool that can help managers optimize their bullpen allocation over multiple games. It appears to support the use of a traditional closer more than a naive greedy approach does, but is clearly not in full alignment with that single heuristic. Instead, it relies on a combination of the game state and the batters due up in the order when making relief pitcher recommendations.
2024 Guardians vs 2024 Guardians
After running the simulation on the Mariners, I wondered if some of the mixed results were due to the fact that top pitcher Andres Munoz was at an unfair disadvantage against a left-heavy Mariners lineup compared to other options like Gabe Speier. Perhaps the series solver would have given Munoz more save opportunities against a more typical lineup.
For this reason, I ran the same simulation on the 2024 Cleveland Guardians. Their closer, Emmanuel Clase, was absolutely dominant that year with no obvious competitors for his closing job. He recorded 47 saves, a WHIP of 0.66, and an ERA of 0.60. If the series solver were ever to go all in on using a closer, it seemed like this would be the team. The matchup model used data up through August of 2024. Here are the constraints I used:
I ran the same number of simulations and then computed the same distributions for each manager as I did with the Mariners.
Overall Results
Again, the series solver added value. This time it added 1.4% per game, scaling to about 2.3 wins per 162 game season.
Usage by Inning
In game one, the greedy manager used Clase, Smith, and Gaddis all over 94% of the time, which exceeded the Mariners most used reliever by a decent margin. This demonstrates that talent is more concentrated in this bullpen, and that we are more likely to see a closer emerge. Predictably, the patient manager cut down on usage rates substantially, frequently using any of the eight relievers.
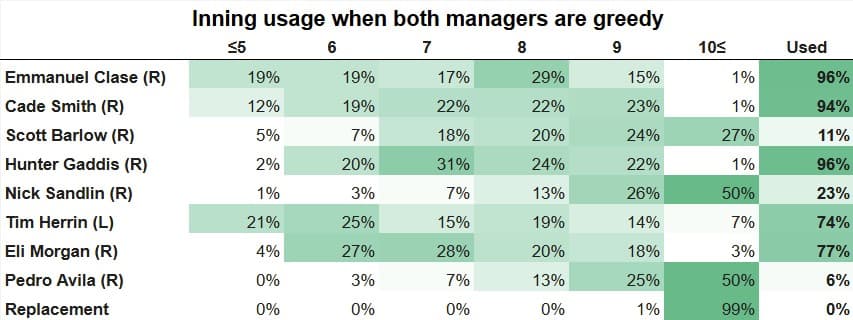
In terms of 9th inning usage, Clase was pitching in the 9th in 31% of his appearances, which is more than Munoz (26%) but less than Speier (45%). The only pitchers with higher 9th inning rates were Barlow (39%) and Sandlin (42%) but we will see in the next table that these two were not being used in save situations.
Usage by Score Deficit
Looking at score deficit usage does reveal that Clase was the preferred option in save situations; 91% of his usage came with his team winning or tied which is the highest on the Guardians and also higher than Munoz (85%) and Speier (89%). However, the patient manager was still giving plenty of looks to Cade Smith, Hunter Gaddis, and Tim Herrin (their only lefty). The inning table shows that many of these were late in the game.
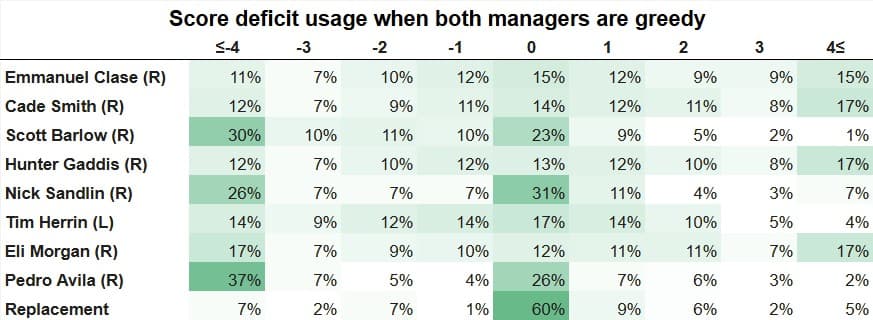
Looking at the difference in score deficit usage between the patient and greedy managers shows the same pattern we saw earlier with the Mariners.
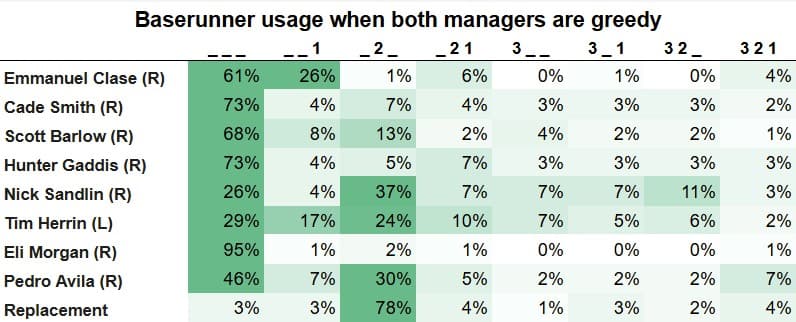
Usage by Baserunner State
Looking at the baserunner states shows that both managers have an even more extreme preference for the beginning of the inning than we saw with the Mariners. Again, this is heavily influenced by the end inning max batters faced constraint which I made pretty low for most of these guys because they do not usually make multi-inning appearances.
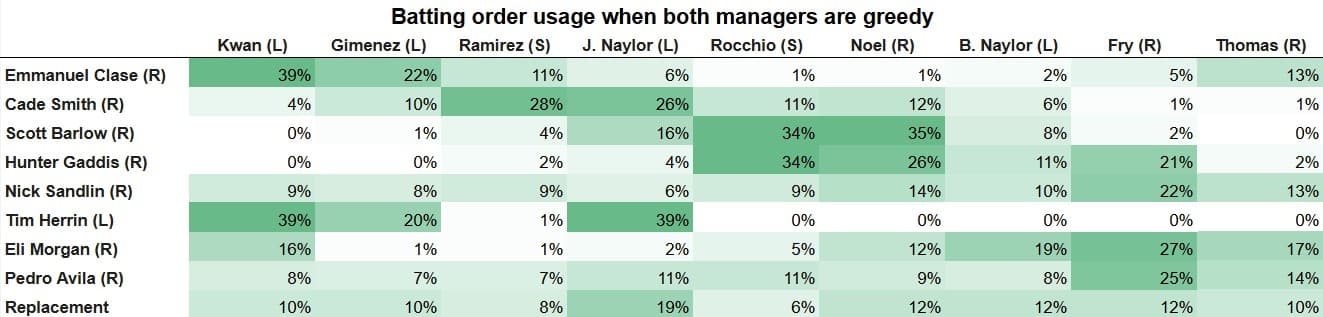
Usage by Batting Order
Again, we see that the current batting order plays a major role in which relievers are used. Since the Guardians only have one lefty in the bullpen (Herrin), Clase is often used to face the top of the lefty-heavy order since he is so good against everyone.
Takeaway
Again, the series solver demonstrates its value. It also suggests that even with a dominant pitcher like Clase, blindly using a closer in every save situation is probably not the optimal approach.
Want to learn more? Try Perfect Game or reach out to our team.